A month of solar panels
Saturday, January 13th, 2024 at 08:13pm
It has now been one month since I had solar panels installed and I am still working out what I want to monitor and how it will change my behaviour.
So what does the monitoring look like?
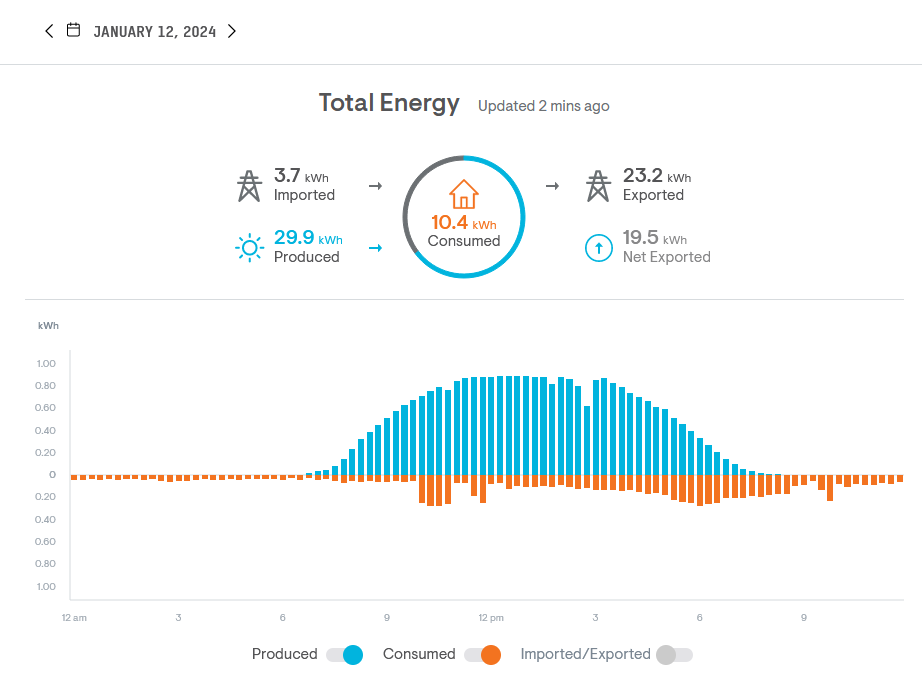
The cloud based monitoring that the Envoy controller reports to gives a status page, but I find the energy reporting to be more interesting. This is the report for yesterday:

There were clouds a couple of times but otherwise it was sunny, so there is a nice curve to the solar production. On the consumption side you can see there at 10am the hot water was on for an hour, then I was cooking lunch with my air fryer at 11:30am. It was a warm day so in the afternoon I turned on the air conditioning to keep things cool.
With the integration into Home Assistant I can get a similar view of the same data through the energy dashboard, though not as granular as it is in one hour (instead of 15 minute) increments:

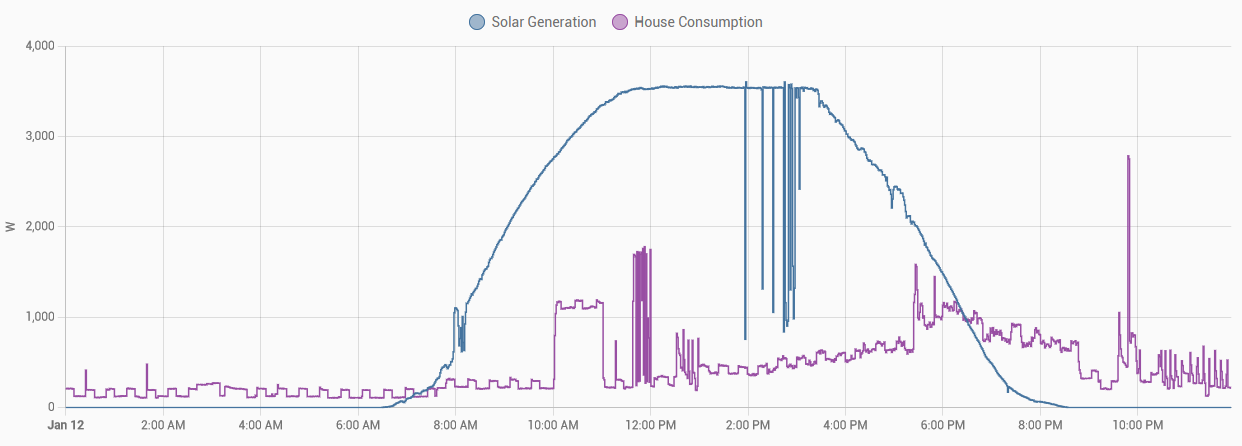
This is getting its data from the “energy production/consumption today” values which are in kWh and reset each day. If I want live information I look at the power values which I have converted to W to be in line with what I get directly from the smart meter, from my UPS and from my tamsota devices. The same day but the power reading which is updated every minute looks like:

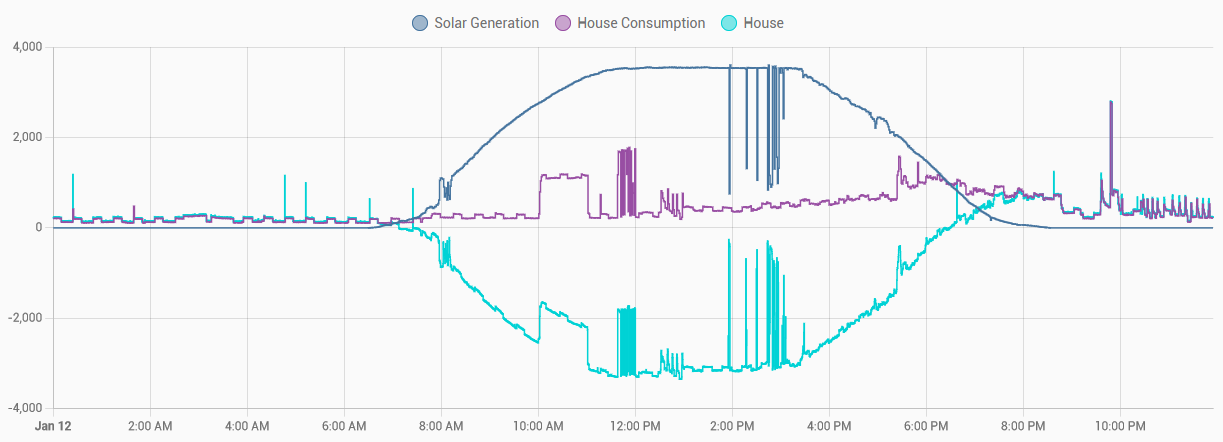
It starts to get messy but I can also include the power reading data from the smart meter (updated every 8 seconds):

If the smart meter reading is positive then I am consuming from the grid, while if it is negative then I am feeding power back to the grid. Of course I am still waiting for my meter/account to be reconfigured so I get paid for what I export…
It is clear that on a sunny day in summer that my solar generation will easily cover the large loads such as hot water, dishwasher, washing machine and lunchtime cooking. What would the numbers look like on my bill?
| Daily charge: | 1 | x | 107.03c/day | = | $1.07 |
| Consumption: | 3.7kWh | x | 22.66c/kWh | = | $0.84 |
| Feed-in: | 23.2kWh | x | -5.40c/kWh | = | -$1.26 |
| Total: | $0.65 | ||||
Not as much of a saving as I expected, but this is only a single day and I was running both AC units as an experiment while I would ideally just be running the one in my study. Definitely need to wait and see how the numbers fall for a full monthly billing cycle…
Tagged with: home automation, house, power, solar
