Is has been over a year since I posted about my home energy usage, when I switched my electricity plan to a time of use plan.
So how has that gone? Courtesy of home assistant I have this pretty chart for 2025:
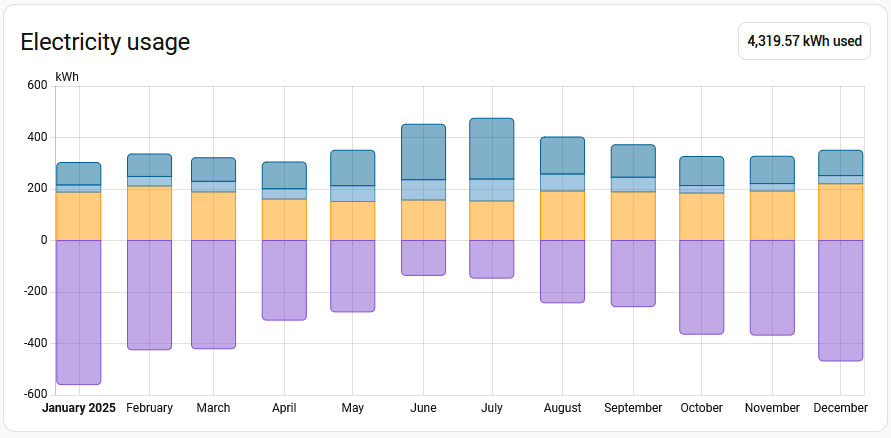
Combined with the other reporting, what does this tell me?
- The total energy i used to get stuff done was 4.32MWh
- My solar panels have generated 6.16MWh, I was only able to directly use one third, with 3.97MWh sent to the grid
- I pulled 2.13MWh from the grid, 1.57MWh in off-peak and 0.58MWh in peak times
- In a summer month I have heaps of excess solar, and overall use less energy (more daylight hours, only use the AC on the hotter days)
- For a winter month I directly consume about half the solar, with overall more energy used (mostly because at least one AC unit will be heating a room when I am awake)
What does this translate to on my bills?
| Rate | Usage | Cost |
|---|
| Daily charge | $1.15/day | 365 days | $419.75 |
| Peak rate | 37.2c/kWh | 584.41 kWh | $217.40 |
| Off-peak rate | 22.3c/kWh | 1546.38 kWh | $344.84 |
| Solar rate | 3.1c/kWh | -3971.23 kWh | $-123.10 |
| Total: | | | $858.89 |
If I look back to 2023 I paid $1,853 for gas and $1,635 for electricity, a total of $3,488. That $858 figure is looking quite nice, it could be said that the changes I made at the end of 2023 (adding solar, removing gas) are saving me $2,500 each year.
I was curious about the impact of solar, so I ran the numbers to estimate what my bills would have been if I had only dropped gas (the addition of AC units) and replaced the hot water system. I likely still would have switched to a time of use tariff and then minimised my usage during peak times, for the calculation I will pro-rata the overall usage:
| Rate | Usage | Cost |
|---|
| Daily charge | $1.15/day | 365 days | $419.75 |
| Peak rate | 37.2c/kWh | 1184.57 kWh | $440.66 |
| Off-peak rate | 22.3c/kWh | 3134.43 kWh | $698.98 |
| Total: | | | $1559.39 |
So based on these numbers, getting rid of gas just removed that bill from the equation. While the savings from switching to a heat pump for hot water were taken up by using the AC units (aka other heat pumps) for heating, with the bonus of now having cooling as an option.
So now back to the question of sending excess solar to the grid. In the two years since the installation the feed in tariff has dropped from 6c/kWh to 3c/kWh, if I were to change plans now it is down to a measly 1c/kWh.
So sending excess solar to the grid should be the last resort. I currently try to have all my large usage loads during the day when there is solar which is hot water, the dishwasher, the washing machine, half of my heating/cooling and more than half of my cooking. The remainder of the heating/cooling and cookie is in the evening, when there is no solar.
I don’t have an EV (yet…) but my car usage is mostly local a couple of times a week, so topping off its battery wouldn’t be significant.
So would it make sense to get a home battery?
Using this as my usage pattern:
| Average day | Consumption | From grid | From solar | Excess solar |
|---|
| Summer | 12.1 kWh | 4.4 kWh | 7.7 kWh | 15.1 kWh |
| Winter | 15.3 kWh | 10.2 kWh | 5.1 kWh | 4.7 kWh |
So what type and size of battery would fit with this usage?
I have yet to dig into the details of batteries but I have seen a number of examples using typical sizes of 6kWh and 10kWh. So in summer I could easily charge up a 6kWh or 10kWh battery from solar every day, only needing the capacity of 6kWh for my overnight usage. However in winter I would need a 10kWh battery to handle my overnight usage, which I would not be able to charge up each day.
Assuming I had a suitable battery, what would I save in grid costs?
In summer all my consumption might be able to be covered directly by solar or by the battery charged up by solar. Any pittance I get from excess solar would go towards offsetting the daily charge, in an ideal month the overall bill might be zero.
For a summer month with the ideal case of drawing nothing from the grid:
| Rate | No battery | With battery |
|---|
| Usage | Cost | Usage | Cost |
|---|
| Daily charge | $1.15/day | 30 days | $34.50 | 30 days | $34.50 |
| Peak rate | 37.2c/kWh | 39.6 kWh | $14.73 | 0.0 kWh | $0.00 |
| Off-peak rate | 22.3c/kWh | 93.2 kWh | $20.78 | 0.0 kWh | $0.00 |
| Solar rate | 3.1c/kWh | -454.3 kWh | $-14.08 | -321.5 kWh | $-9.97 |
| Total: | $55.93 | $24.53 |
That is looking promising, with the monthly bill in summer being halved, but with batteries looking to cost at least $8000, that is a 25 year ROI… and what about a winter month where all the excess solar goes into the battery to offset part of the grid usage?
| Rate | No battery | With battery |
|---|
| Usage | Cost | Usage | Cost |
|---|
| Daily charge | $1.15/day | 30 days | $34.50 | 30 days | $34.50 |
| Peak rate | 37.2c/kWh | 85.3 kWh | $31.73 | 46.6 kWh | $17.34 |
| Off-peak rate | 22.3c/kWh | 236.3 kWh | $52.69 | 128.8 kWh | $28.72 |
| Solar rate | 3.1c/kWh | -146.2 kWh | $-4.53 | -0 kWh | $0.00 |
| Total: | $114.39 | $80.56 |
Hmmm… I didn’t quite expect for the bill reduction to be around the same, and it might be an artifact of these specific numbers, but with the additional saving being so small it is not looking like a home battery would be a good option for me.
Apart from general chatter in news and other places about batteries, the one thing that triggered my thinking about it was an email from the company that installed my solar panels, I will see what they will suggest (with the awareness that they are trying to sell their services).