Charting electricity
Sunday, November 5th, 2023 at 12:50pm
Continuing my thinking about how I heat and cool things in my house I have given my electricty bills the same treatment that I gave to my gas bills and produced another glorious Excel chart:

I have what is referred to as a “controlled load” which is that my electric hot water is on a dedicated circuit that only runs overnight (typically from 11pm until 8am) for a lower rate. I think I can see that there was a time when the consumption was fairly evenly split between hot water and everything else, but then once I started working from home the controlled load dropped a bit while the peak usage jumped up a fair amount.
I didn’t dwell too much on this data because there is a different data set that is much more detailed. If I want extreme detail I could go to the log of what I get directly from my smart meter, but an instantaneous power figure every eight seconds is a lot, and it only reports the peak usage, it doesn’t (though it did originally) report the controlled load.
The other data set I am referring to is the one that I can get from my electricity distributor as that is in a format of half hour blocks, essentially what the electricity retailer uses to calculate bills. Importantly this does include two sets, one for the peak usage and another for the controlled load.
I looked at this data in a few different ways but in the end summed up the half hour blocks for an entire month, this is for October 2023:
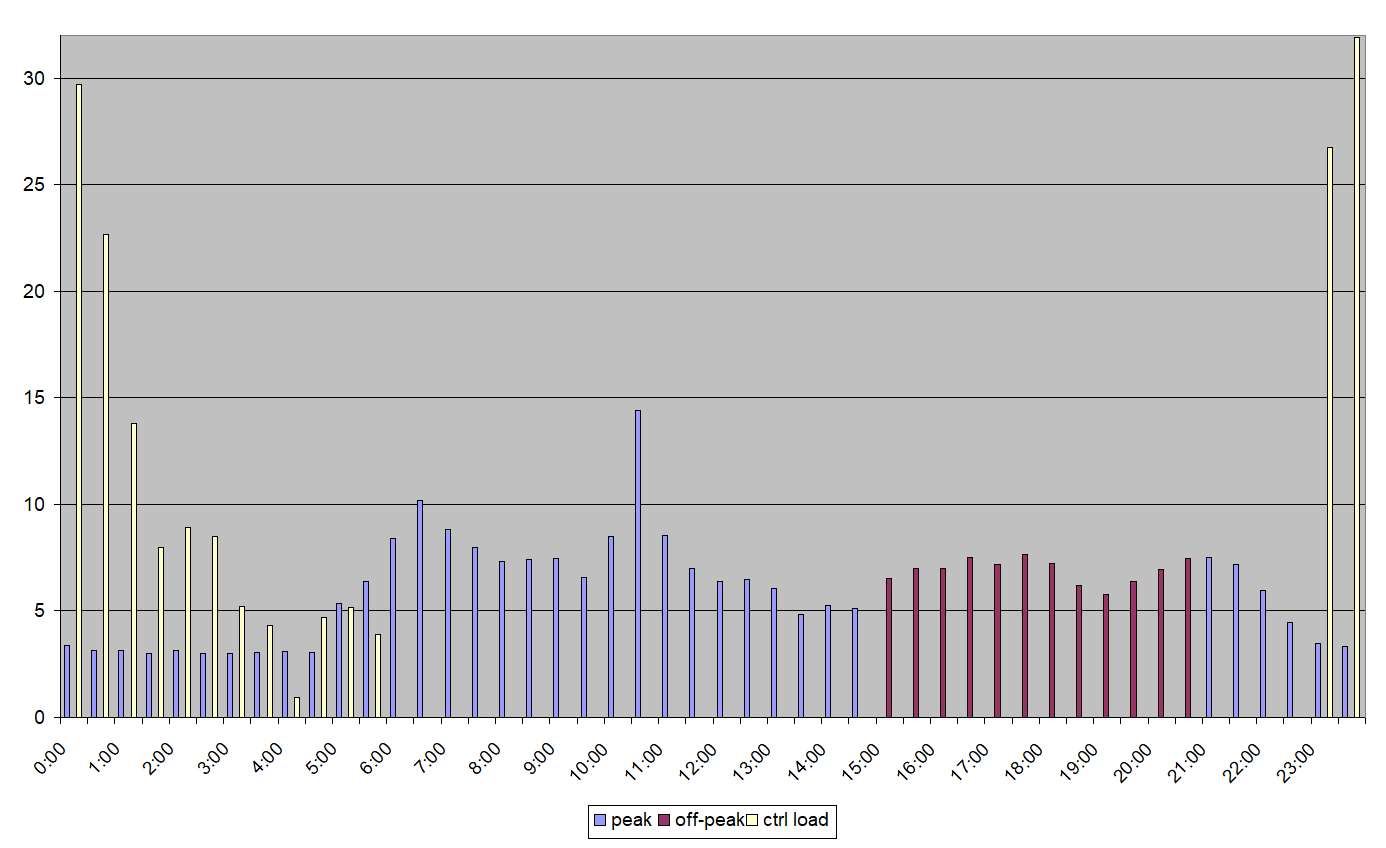
(Note that the peak and off-peak distinction is not real, I split them in the chart for something I will explain below, they are both currently billed as the same peak rate)
You can clearly see the controlled load turning on at 11pm to start heating up the hot water, then it drops off throughout the night as the amount of water that needs heating each day is different. Not sure what the bump around 5pm is caused by.
Looking at the peak usage there is a baseline visible overnight, then usage increases as I start working from home, a spike at lunchtime when I cook, followed by afternoon and then evening usage. There is no spike for dinner because that is just reheating the other half of the Hello Fresh meal that I cooked for lunch.
I was able to apply my current rates to this data and end up with the same amount as my bill for that month.
Another plan my electricity retailer offers is a time of use plan, where the usage is split into peak being 3pm to 9pm and then off-peak being 9pm until 3pm. The controlled load is still separate from this.
These rates are currently:
| Single rate with controlled load | Time of use with controlled load | |
|---|---|---|
| Supply charge: | 107.03 c/day | 107.03 c/day |
| Peak rate: | 22.66 c/kWh | 29.48 c/kWh |
| Off-peak rate: | N/A | 19.03 c/kWh |
| Controlled load rate: | 17.60 c/kWh | 17.60 c/kWh |
I have the data, so what if I calculated the cost of these plans against my past usage?
| Single rate with controlled load | Time of use with controlled load | Difference | |
|---|---|---|---|
| July 2023 | $152.97 | $152.52 | -$0.45 |
| August 2023 | $141.26 | $140.01 | -$1.25 |
| September 2023 | $128.33 | $127.40 | -$0.93 |
| October 2023 | $130.48 | $128.46 | -$2.03 |
So there would be a slight benefit to switching to the time of use plan.
I haven’t been tracking the usage, but I think I do usually run the dishwasher and washing machine in the evening. It doesn’t make a difference while on the single rate plan, but that could be a big change if on time of use. For this I will find some plug in power meters that can report to Home Assistant (ideally MQTT based) so I can track it.
There are also some other options with other electricty retailers with a number of them offering three rates:
- Peak – 3pm to 9pm
- Off-Peak – 10am to 3pm
- Shoulder – all other times
Then there is a retailer such as Amber which gives a half-hourly rate that is based on the live wholesale rate. I don’t know if any others that do this, and this is where you don’t want to just run loads like washing in off-peak, but automate it so that it runs when the live rate is low. I’m not at that point yet, but maybe someday.
Some other things I haven’t covered in this post are the impact of switching to heat pump hot water, running air conditioning all year round, and installing solar panels…
